Cardiovascular & Metabolic Health
Cardiovascular Risk Scores and Heart Age:
What Your Numbers Add Up To
Blood pressure, cholesterol, blood sugar and smoking each raise the risk of heart attack and stroke, but what matters most is how they add up. Risk scores combine these factors into a single estimate, usually the chance of a heart attack or stroke over the next 10 years, which guides decisions such as whether to start a statin. "Heart age" turns the same calculation into a more intuitive number: the age of a person with ideal risk factors who has the same risk as you. In a US study, men's hearts were on average 7.8 years "older" than their real age, and women's 5.4 years. Risk scores have important limits. The same risk factors carry very different risks in different parts of the world: in the World Health Organization's charts, the same 60-year-old male smoker had a 10-year risk of 11% in one region and 30% in another. Standard scores can also underestimate risk in South Asians and in young people, whose 10-year risk may be low but whose lifetime risk is high. This article explains how risk scores work, which ones exist, and how to interpret your result.
Key numbers
| Finding | Detail |
|---|---|
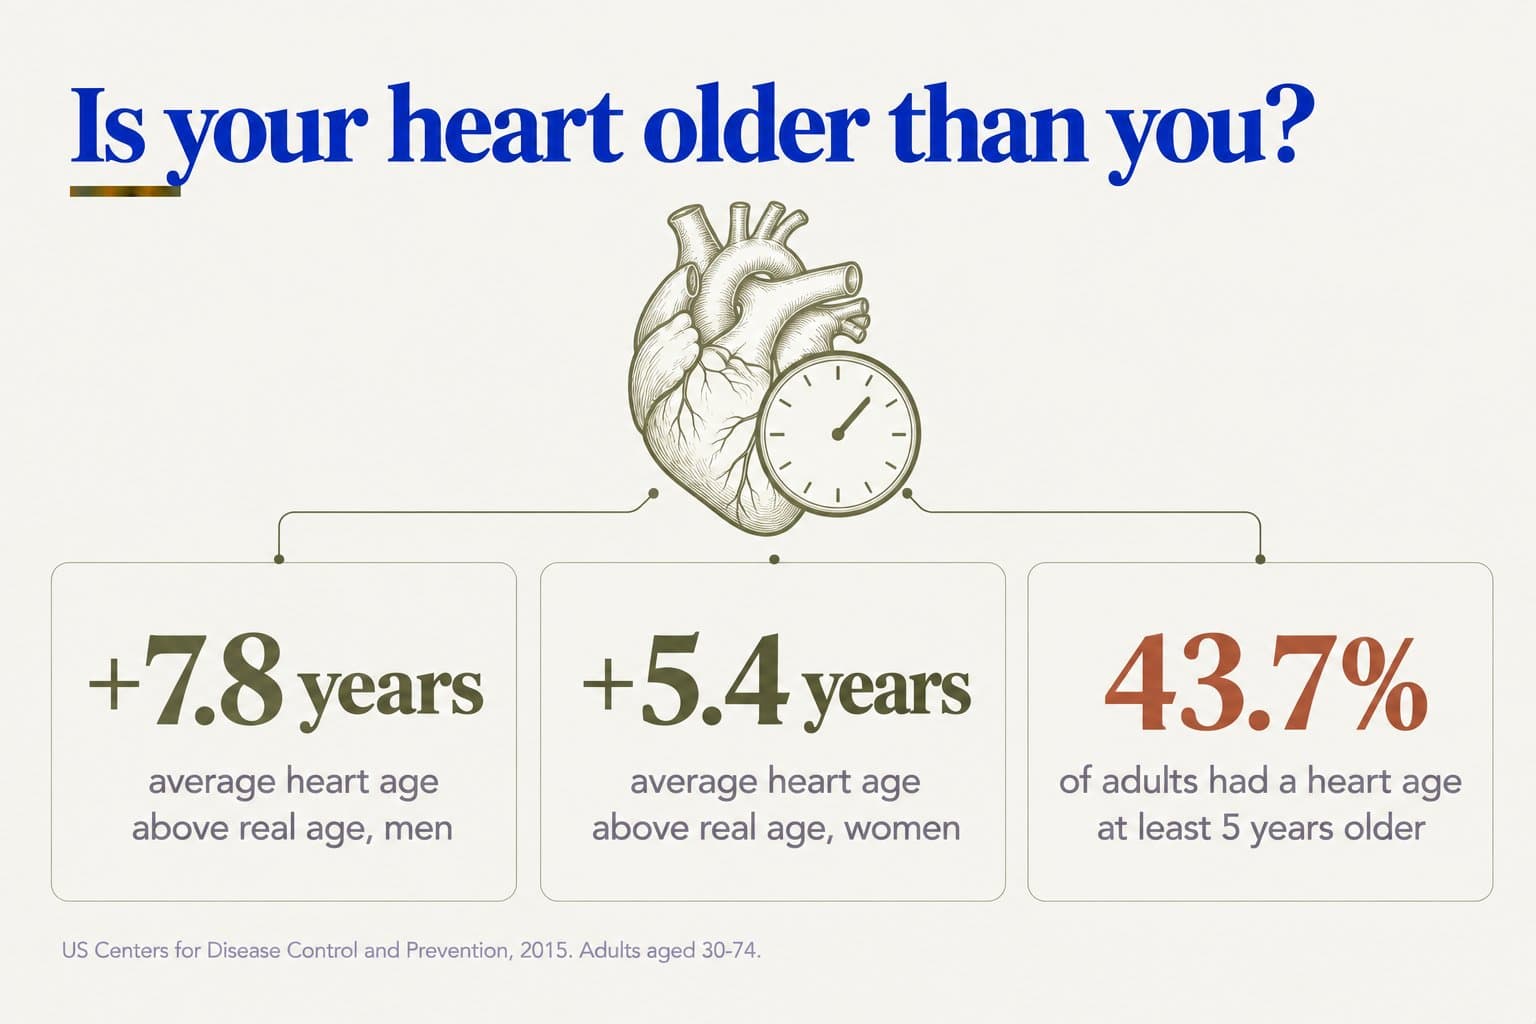
| Heart age in US adults aged 30-74 (CDC) | On average 7.8 years older than real age in men, and 5.4 years in women |
| Adults with a heart age at least 5 years older than their real age | 43.7% (48.8% of men, 38.5% of women) |
| WHO cardiovascular risk charts (2019) | Built from 376,177 people in 85 cohorts, adapted to 21 world regions, including South Asia |
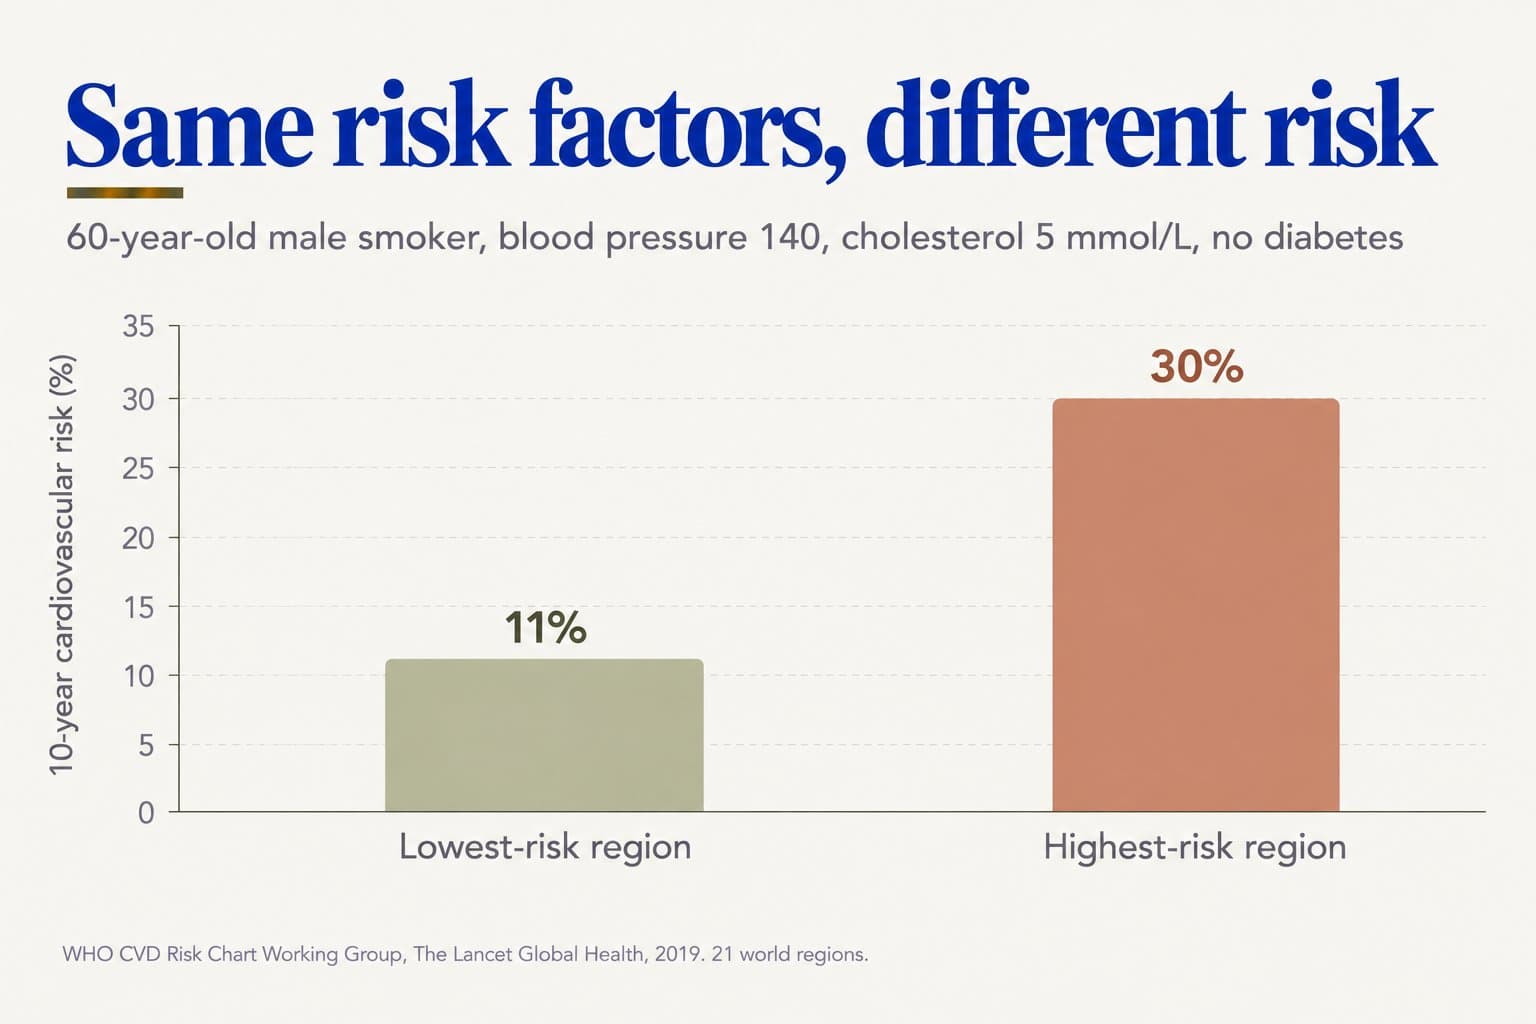
| Same risk factors, different region (60-year-old male smoker, BP 140, cholesterol 5 mmol/L, no diabetes) | 10-year risk ranged from 11% to 30% depending on region |
| AHA PREVENT calculator (2023) | Developed from more than 6 million US adults; estimates 10- and 30-year risk from age 30, including heart failure |
How risk scores work
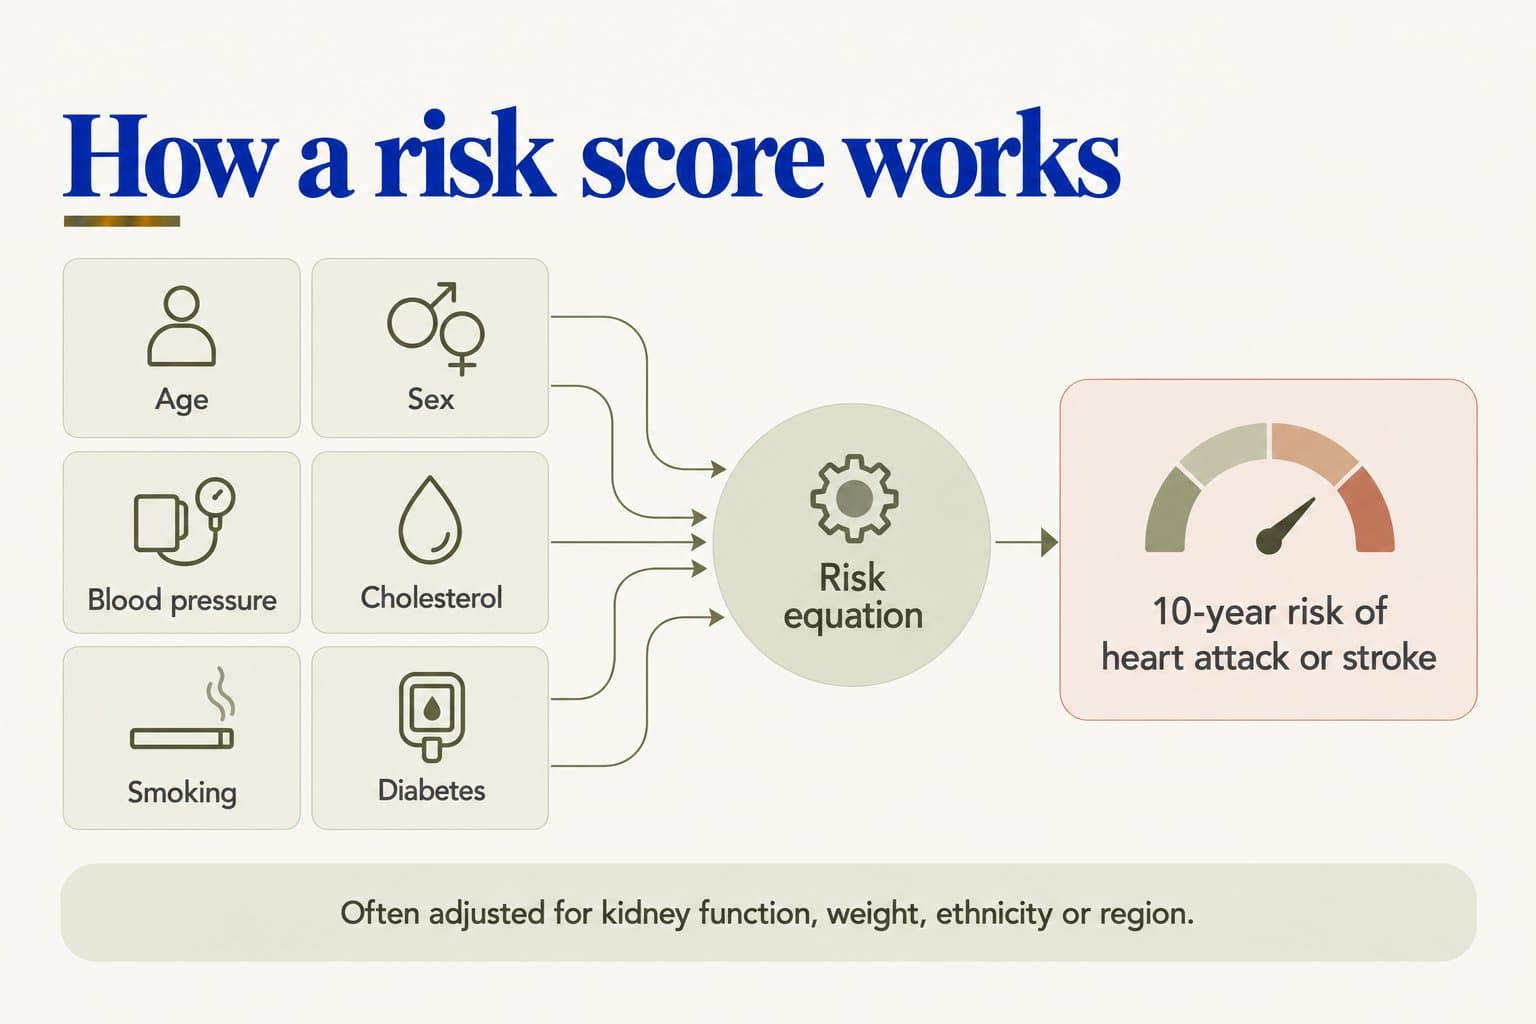
A risk score is an equation developed from large studies that followed thousands of people over time and recorded who had a heart attack or stroke. It uses your risk factors to estimate your chance of a cardiovascular event over a set period, usually 10 years.
Most scores use similar inputs:
- Age and sex, the strongest predictors
- Blood pressure, and whether it's treated
- Cholesterol (total and HDL, or non-HDL)
- Smoking
- Diabetes
- Sometimes: body mass index, kidney function, family history, ethnicity or social deprivation
The result is usually grouped into bands. For example, American guidelines class 10-year risk under 5% as low, 5-7.5% as borderline, 7.5-20% as intermediate and 20% or more as high. Higher-risk groups benefit most from treatments such as statins and blood pressure medicines.
The main risk scores
| Score | Used mainly in | Notes |
|---|---|---|
| WHO risk charts (2019) | Worldwide, including South Asia | Versions with and without a cholesterol test; calibrated to 21 regions |
| Pooled Cohort Equations (2013) | United States | Developed mainly in white and Black Americans |
| PREVENT (2023) | United States | Ages 30-79; adds kidney function; 10- and 30-year risk; predicts heart failure too |
| QRISK3 | United Kingdom | Includes ethnicity, including South Asian groups, plus other conditions |
| SCORE2 | Europe | Calibrated to different European risk regions |
What the research shows
Where you live changes what your numbers mean. The World Health Organization's 2019 risk charts were built from 376,177 people in 85 cohorts, with 19,333 heart attacks and strokes over 10 years, and then recalibrated to 21 world regions using national survey data. The same risk factors carried very different risks across regions. For a 60-year-old male smoker without diabetes, with a systolic blood pressure of 140 mmHg and cholesterol of 5 mmol/L, the estimated 10-year risk ranged from 11% in one region to 30% in another. A score built for one population can therefore misjudge risk in another.
Scores may underestimate risk in South Asians. Many widely used scores were developed mainly in European or American populations. South Asians tend to develop heart disease earlier and at lower levels of traditional risk factors, partly because of insulin resistance, more visceral fat at lower body weight, and higher lipoprotein(a) (see LDL, ApoB and Lipoprotein(a) and What Metabolic Health Really Means). American guidelines list South Asian ancestry as a "risk-enhancing factor" that can tip borderline or intermediate-risk decisions toward treatment. The UK's QRISK3 includes South Asian ethnicity directly. South Asian cardiovascular risk is covered in detail in South Asian Cardiovascular Risk.
Ten-year risk can mislead younger people. Because age is the strongest factor in most scores, younger adults almost always have a low 10-year risk, even with high cholesterol or blood pressure. But atherosclerosis builds up over decades (see How Atherosclerosis Develops). Lifetime or 30-year risk estimates, such as those in the PREVENT calculator, give a truer picture for people in their 30s and 40s, and can show that acting early has the biggest payoff.
Heart age makes risk easier to understand. A 10-year risk of 6% can be hard to interpret. "Heart age" converts it into the age at which a person with ideal risk factors would have the same risk. The US Centers for Disease Control and Prevention estimated heart age for adults aged 30-74. On average, men's heart age was 7.8 years older than their real age and women's was 5.4 years older, and 43.7% of adults had a heart age at least 5 years older than their real age. Heart age is a communication tool rather than a separate measure, but it can make risk more meaningful and motivating.
Refining an intermediate result. When a score gives a borderline or intermediate result, other information can help. Risk-enhancing factors include a family history of early heart disease, persistently high LDL, metabolic syndrome, chronic kidney disease, high lipoprotein(a), inflammatory conditions, pregnancy complications such as pre-eclampsia, and South Asian ancestry. A coronary artery calcium scan can also reclassify risk (see Coronary Calcium Scoring).
Why this matters for longevity
Risk scores help focus prevention on the people most likely to benefit. But they're a starting point, not a verdict. A "low" 10-year risk in your 30s or 40s doesn't mean your arteries are healthy, and scores built on other populations may underestimate risk in South Asians. The most useful approach combines a calculated risk with lifetime risk, family history and, when needed, further tests, and then acts on the risk factors you can change. Every improvement in blood pressure, cholesterol, blood sugar or smoking lowers your score and your heart age.
Practical notes
- Ask for your 10-year risk from about age 40, or earlier if you have risk factors or a family history of early heart disease.
- Ask about lifetime or 30-year risk if you're younger and your 10-year risk is "low".
- Mention South Asian ancestry and family history, which standard scores may not fully capture.
- Use heart age as motivation: re-check it after improving blood pressure, cholesterol or stopping smoking.
- Know your inputs: blood pressure, total and HDL cholesterol, blood sugar or HbA1c, and smoking status.
- Yang Q, et al. Vital Signs: Predicted heart age and racial disparities in heart age among U.S. adults at the state level. Morbidity and Mortality Weekly Report, 2015;64(34):950-958.
- WHO CVD Risk Chart Working Group. World Health Organization cardiovascular disease risk charts: revised models to estimate risk in 21 global regions. The Lancet Global Health, 2019;7(10):e1332-e1345.
- Khan SS, et al. Development and validation of the American Heart Association's PREVENT equations. Circulation, 2024;149(6):430-449.
- Arnett DK, et al. 2019 ACC/AHA Guideline on the Primary Prevention of Cardiovascular Disease. Journal of the American College of Cardiology, 2019;74(10):e177-e232.
- Hippisley-Cox J, Coupland C, Brindle P. Development and validation of QRISK3 risk prediction algorithms to estimate future risk of cardiovascular disease: prospective cohort study. BMJ, 2017;357:j2099.
Free longevity assessment
Do you know your 10-year
cardiovascular risk?
Take the free Aevum Protocol assessment to see how your cardiovascular & metabolic health and 6 other longevity domains are performing — and get a personalised 90-day plan.
Take the free assessmentKeep reading
Related articles
Cardiovascular & Metabolic Health
How Atherosclerosis Develops: The Decades-Long Process Behind Heart Attacks and Strokes
Cardiovascular & Metabolic Health
Coronary Calcium Scoring: What a Heart Scan Can and Can't Tell You
Cardiovascular & Metabolic Health