Cognitive Longevity
The Aging Brain:
What Actually Changes With Age
Brain aging is often talked about vaguely — "the brain shrinks," "you lose brain cells" — without much precision about what's actually happening, how fast, or whether it's uniform. The reality, from decades of longitudinal MRI tracking, is more specific and more useful: brain volume loss is real and measurable from healthy midlife onward, it isn't evenly distributed across brain regions, and the rate of decline itself accelerates at a fairly well-defined point in later life rather than progressing as a steady slope. This article lays out what the actual imaging data shows, setting up the framework the rest of this series builds on.
Key numbers
| Finding | Detail |
|---|---|
| Total brain volume loss (healthy older adults) | ~5.4 cm³/year (roughly 0.5% of total brain volume) |
| Gray matter loss | ~2.4 cm³/year |
| White matter loss | ~3.1 cm³/year |
| Ventricular CSF expansion | ~1.4 cm³/year — a small absolute volume, but proportionally large relative to the ventricles' own small starting size |
| Hippocampal shrinkage (non-demented elderly) | 0.68%/year (men), 0.79%/year (women) |
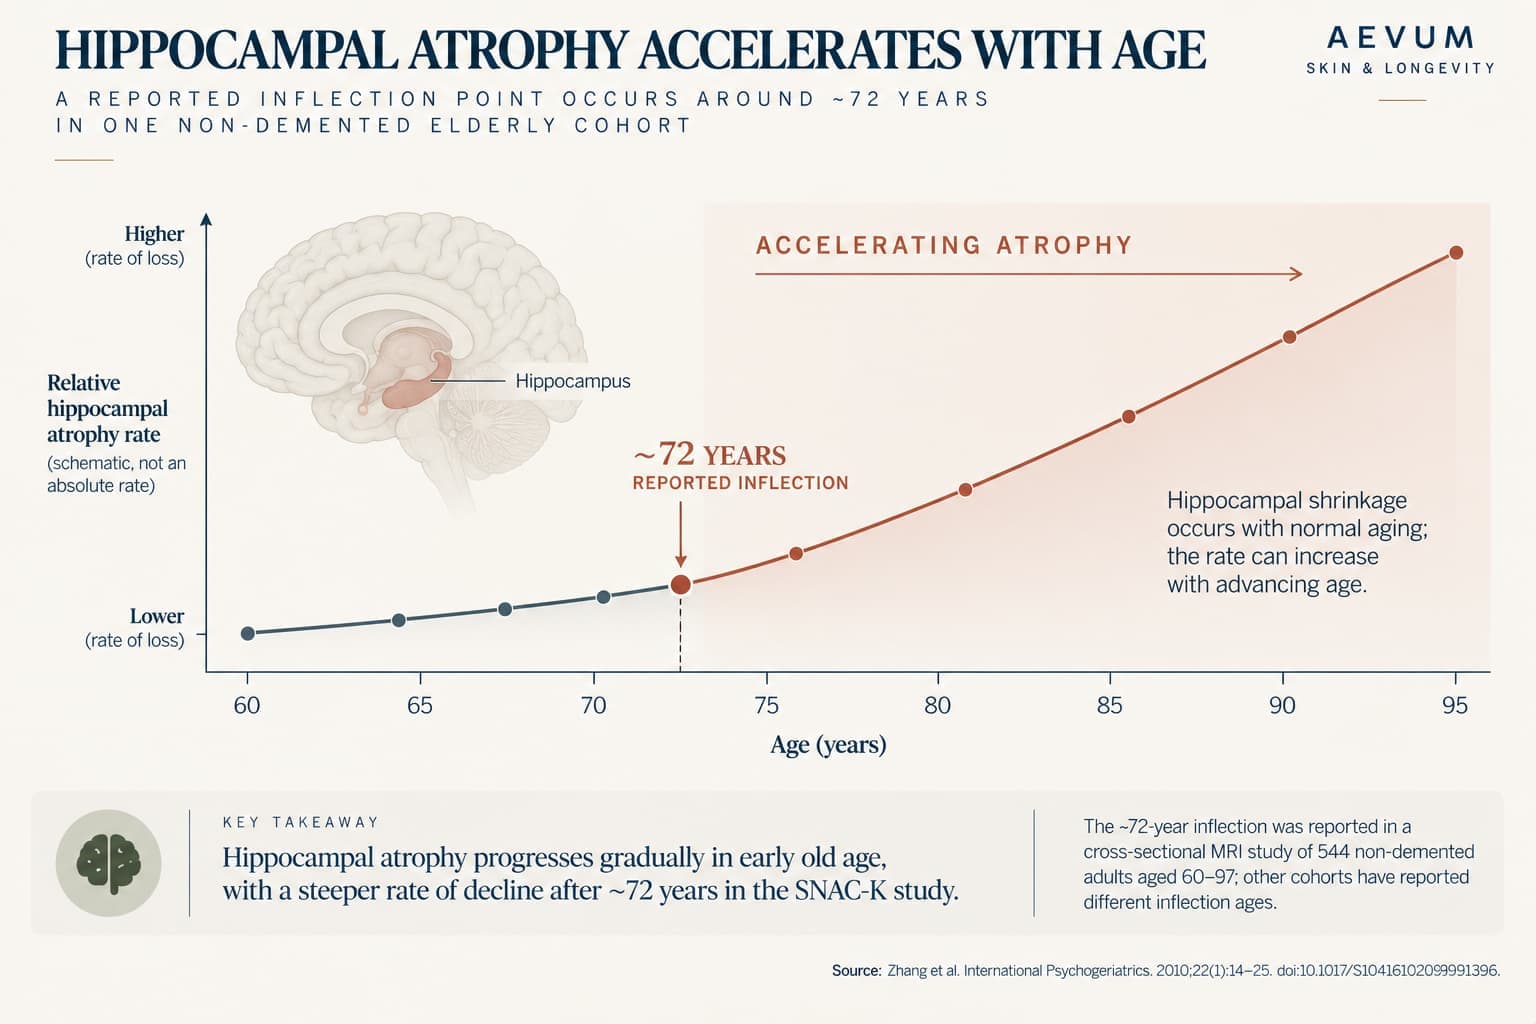
| Age at which hippocampal atrophy accelerates | ~72 years (piecewise regression-identified threshold) |
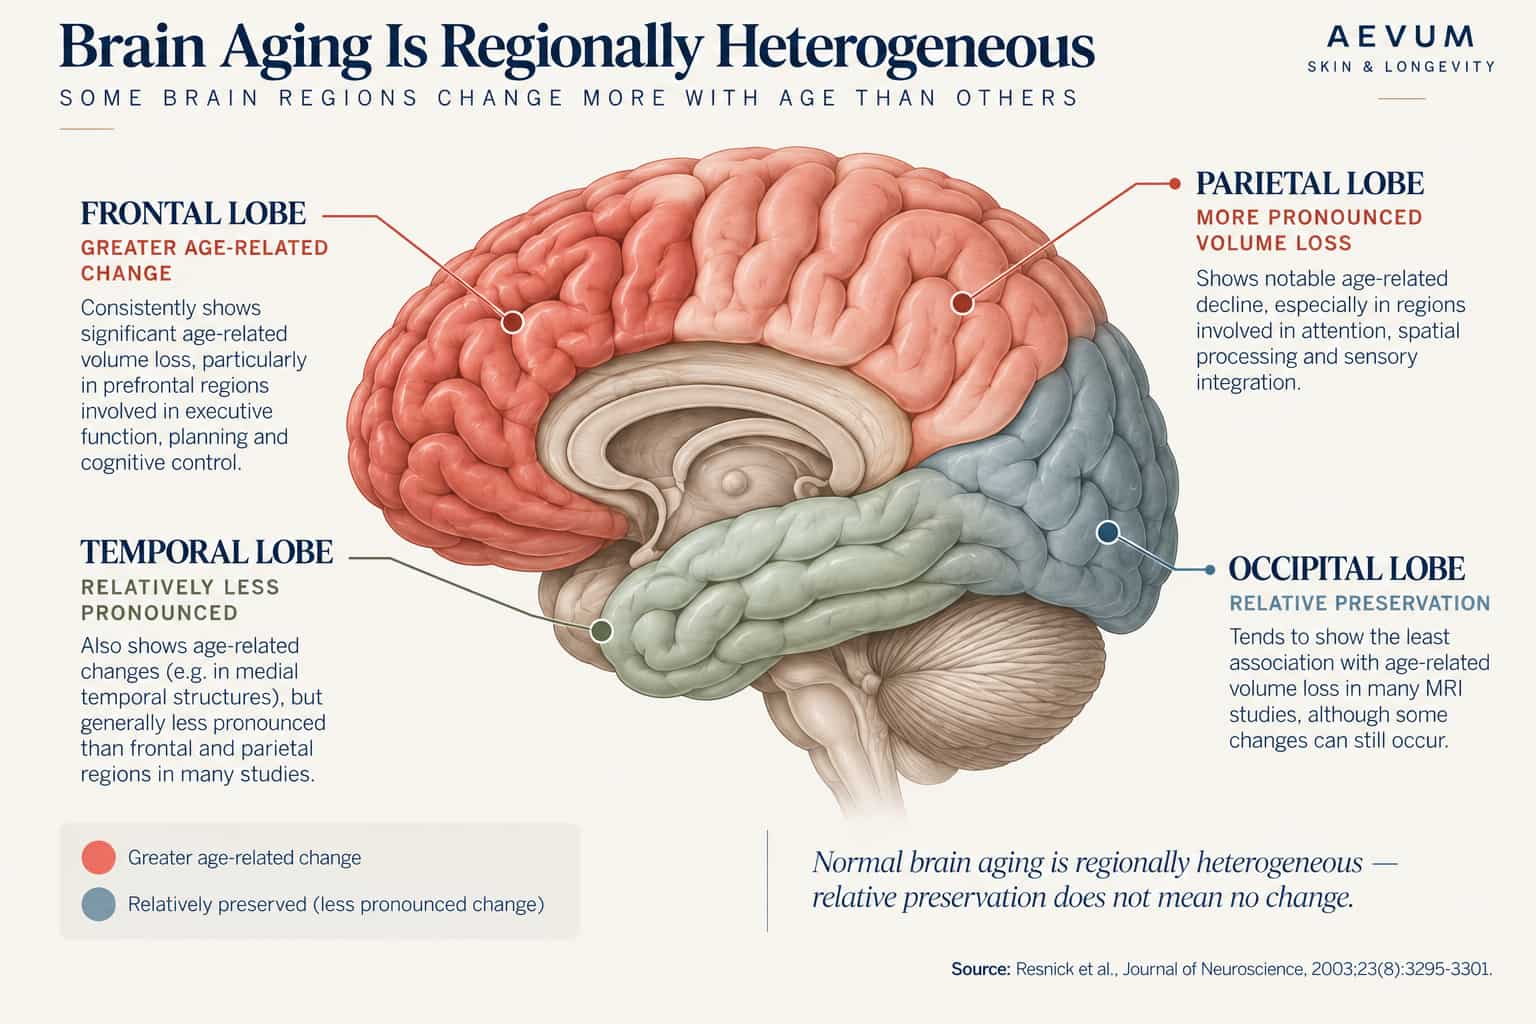
| Regions showing greatest decline | Frontal and parietal lobes (more than temporal/occipital) |
How it works
Brain volume loss is real, gradual, and regionally uneven. A landmark longitudinal MRI study from the Baltimore Longitudinal Study of Aging (BLSA) tracked 92 cognitively healthy older adults (ages 59-85 at baseline) with repeated high-resolution scans over several years. It found total brain volume declining at roughly 5.4 cm³ per year in healthy aging — a real, measurable, steady loss, not a marketing exaggeration. But this loss wasn't uniform: frontal and parietal regions showed significantly more decline than temporal and occipital regions, with gray matter loss concentrated specifically in the orbital and inferior frontal cortex, cingulate cortex, and insula. This regional pattern matters because these frontal regions are heavily involved in executive function, planning, and working memory — which helps explain why those specific cognitive domains often show earlier, more noticeable change than others like long-term memory or vocabulary, which tend to hold up longer.
Cerebrospinal fluid space expands proportionally faster than tissue shrinks. As brain tissue volume declines, the ventricles (the fluid-filled spaces inside the brain) expand to fill the space — increasing by about 1.4 cm³ per year in the BLSA cohort. Because the ventricles start out far smaller than total brain volume, this absolute increase represents a much larger relative change than the brain's overall shrinkage, which is part of why ventricular enlargement is such a visually obvious marker on a scan, often used as an accessible proxy for overall brain aging even by non-specialists reading a report.
Decline isn't linear — there's a real inflection point. The most clinically important nuance in this data: brain aging doesn't proceed as a smooth, constant-rate decline throughout life. A separate cohort study (the SNAC-K study, tracking 544 non-demented adults aged 60-97) used piecewise regression analysis on hippocampal volume specifically and identified a statistically distinct acceleration point at approximately age 72, where the slope of hippocampal shrinkage becomes measurably steeper than it was before that age — mirroring the accelerating-decline pattern already established for cardiorespiratory fitness in this series (see Exercise Across the Decades). The same study also found a sex difference worth noting: despite men having smaller absolute hippocampal volumes on average, women showed somewhat greater vulnerability to atrophy in this specific dataset — a finding consistent with broader research linking menopause-related hormonal change to accelerated brain aging in some women.
What the research shows
"Normal" aging still involves real structural change — but the rate genuinely varies between people. One of the more reassuring findings from this same body of research: subgroups of especially healthy older adults with fewer cardiovascular risk factors tend to show measurable brain atrophy over time, but at a meaningfully reduced rate compared to less healthy peers — a pattern reported across several BLSA-linked studies tracking cardiovascular risk factors and brain volume together. This is the core evidence behind the idea of modifiable brain aging: structural decline in the brain isn't an all-or-nothing inevitability happening at a fixed rate for everyone — it happens to almost everyone to some degree, but how fast it happens is shaped by factors that are, at least partly, within a person's control. That's the throughline for the rest of this series: which specific factors move that rate, and by how much.
This is baseline, not diagnosis. It's worth being explicit about what this data does and doesn't mean: gradual volume loss with age, even in the frontal lobes, even accelerating somewhat after 70, is the expected pattern in cognitively healthy people — it is not, by itself, a sign of dementia or disease. The imaging changes that distinguish pathological decline (Alzheimer's disease, for instance) from healthy aging are distinct and more pronounced, covered in our upcoming Mild Cognitive Impairment and Alzheimer's Modifiable Risk Factors articles. Understanding what normal aging looks like on a scan is what makes it possible to recognize when something looks abnormal instead.
Recommendations
- 1Treat this as context, not a diagnosis
Age-related volume loss and mild ventricular expansion on a brain scan, especially before 70, is broadly consistent with normal aging rather than a specific concern on its own.
- 2The frontal-lobe-first pattern explains common, normal complaints
Noticing that planning, multitasking, or working memory feel slightly less sharp before other cognitive domains change is consistent with where volume loss concentrates first — worth knowing so it doesn't get over-interpreted as an early warning sign by itself.
- 3The rate is more useful to think about than the fact of decline itself
Since healthier individuals in the research show measurably slower atrophy, the actionable question isn't "can I stop this" but "what measurably slows the rate" — the subject of most of the rest of this series.
- 4Age 70-72 is a reasonable point to pay closer attention
Given the identified acceleration threshold, this is a sensible window to become more deliberate about the modifiable factors covered elsewhere in this series (exercise, sleep, vascular health, social connection), rather than waiting for symptoms to appear.
Practical notes
The rest of this Cognitive Longevity series works from this baseline: given that measurable brain change is a normal, near-universal part of aging, which specific factors genuinely change its trajectory, by how much, and with what strength of evidence. The frontal-lobe, accelerating-decline pattern established here recurs as reference context throughout.
- Resnick SM, Pham DL, Kraut MA, Zonderman AB, Davatzikos C. Longitudinal Magnetic Resonance Imaging Studies of Older Adults: A Shrinking Brain. Journal of Neuroscience, 2003;23(8):3295-3301.
- Zhang Y, Qiu C, Lindberg O, et al. Acceleration of hippocampal atrophy in a non-demented elderly population: the SNAC-K study. International Psychogeriatrics, 2010;22(1):14-25.
Has anyone in your family
been affected by dementia or memory decline?
Take the free Aevum Protocol assessment to see how your cognitive longevity and 6 other longevity domains are performing — and get a personalised 90-day plan.
Take the Free Assessment →